CFD-based analysis for in-line chemical dosing systems
Background
In sophisticated dosing systems for water and wastewater treatment, chemicals or additives are injected and mixed directly in the process flow. This avoids the need of extra equipment in the process in contrast to conventional systems. Dosing systems are usually used to inject anti-foaming agents, corrosion inhibitors, descalers, biocides, oxygen scavengers, odorants, dyes, and neutralizing agents in the process flow.

In-line systems may suffer from an over-concentration at the dosing point which can be prevented by the introduction of static mixers and a faster, homogeneous distribution in the process flow can be achieved. Nevertheless, injecting a relatively small flow of chemical liquid into a larger stream is a common mixing and control challenge. Inefficient mixing can lead to undesirable competitive reactions or the formation of secondary products and it can also have a direct impact in the consumption of fresh water, chemicals and energy.
Methodology
PRE Technologies have developed a comprehensive set of computational analysis tools that can be used in the evaluation of the performance of these dosing systems. These tools are also of great use in the optimisation of existing systems, through the selection of the most effective retrofit modifications leading to an improvement in the system’s performance.
The hydrodynamics model for this type of systems is built using 3D CFD simulations of the internal flow in the main pipe. The transport of chemical species is also determined and its progression tracked throughout the simulation domain.
The benefits of this 3D computational approach are the direct visualisation of the internal flow and the actual distribution of additives, as well as the quantification of the quality of mixing in the system with a high degree of accuracy without the need to resort to physical measurements.
Example
Geometry and simulation cases
The simulation model in this example consists of a pipe section with a 180° bend of a larger process system. The pipe has two injection locations for additives to be injected in the main flow. The injection of additives is made through injection quills and their location in the system can be seen in the next figure.

This design must ensure that the additive injected in the first injection location (Additive 1) must be fully mixed with the bulk flow before reaching the second injection location to avoid or minimise competitive reactions between additives.
Turbulence promotes the dispersion of the additives in the system given a sufficiently long length of pipe. In this case, however, complete mixing of additives was required in shorter distances and measures were taken in the system to promote faster mixing of the additives. Different system configurations were tested that included the introduction of multiple injection quills at each injection location or the inclusion of two different static mixer geometries.
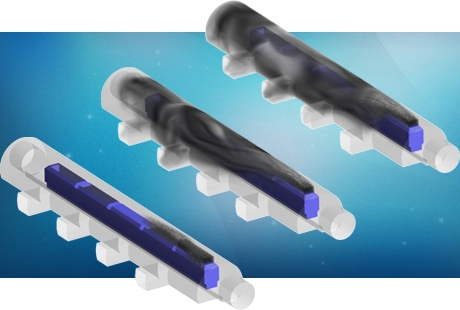
One of the static mixers used was a structured static mixer. This type of static mixers is made of stacked lamellar elements positioned to create an intricate network of flow channels and promote flow in the radial direction. The other static mixer type tested was a vortex generating static mixer where mixing is accomplished by controlled vortex structures generated by elements that suddenly change the cross section of the pipe. The next figure and table present the configuration of the injection zones and static mixers used for all cases.


Simulation results
The next figure presents the results for the four cases described above.

For the original configuration, Case A, the transport of injected additive is essentially kept parallel to the pipe walls for a long distance and dispersion occurs gradually along the pipe.
In this case, the turbulence in the bulk fluid and the pipe length is not sufficient to ensure a complete mixing and both additives still remain considerably segregated from the main flow. This can also be seen in the next figure, showing the distribution of Additive 1 concentration in 3 different cross-section cuts in the system. In this figure, the distance to the injection point is measured in number of diameters of the pipe cross-section. Before the second injection location, the additive is not fully mixed.

For case B, 3 injection points were distributed radially per injection location. This resulted in an improvement on the dispersion of additives in the system but solely due to the fact that the additives are already more distributed at the injection location. The dispersion of additive still occurs gradually for a relatively long length of pipe. Nevertheless, this measure was enough to ensure that Additive 1 is reasonably mixed (although some segregation is still observed) before reaching the second injection location.
When the static mixers were included in the pipe for Case C, mixing of additives happens considerably faster and in this case, immediately after passing through the static mixer, both additives are completely mixed. It is guaranteed in this case that Additive 1 is completely mixed before reaching the second injection point.
The second static mixer had a similar effect to the dispersion of additives is considerably faster in comparison to Cases A and B. In this case, it is also guaranteed that the Additive 1 is completely mixed before reaching the second injection point
To better compare the results between different cases, the quality of mixing was quantified. This was achieved by calculating the Coefficient of Variation (CoV), which gives information on the variance of concentrations in different sections of the pipe after the injection of chemicals,

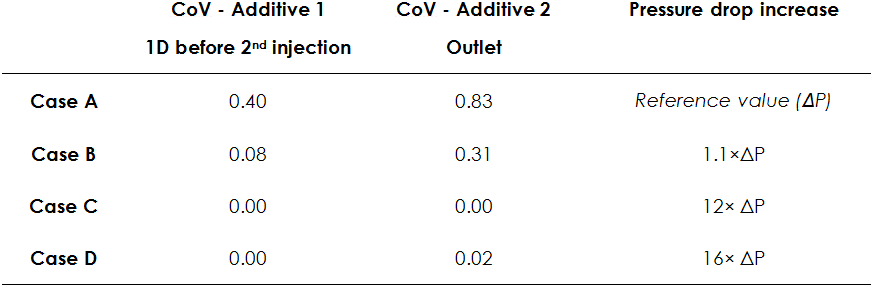
where N is the number of sampling points, Ci is the local concentration at a given sampling point and Cmean is the concentration observed when complete mixing is achieved. The CoV was computed for each case and results are presented in the next table. Values of CoV range between 0 and 1. A value of 1 indicates that the two fluids remain completely segregated and a value of 0 indicates that complete mixing was achieved.

As stated before, both static mixers are extremely efficient on mixing the two additives in the system and a CoV of 0 is achieved for both of them.
The increase in the turbulent intensity is made at the expense of an increase in the pressure drop across the system; this being one of the main drawbacks in the use of static mixers. The previous table also summarises the pressure drop increase calculated for each case. Nevertheless, the pressure increase is probably negligible in the whole process system and should not represent a relevant increase in the operation costs.
The improvement in the mixing by the use of static mixers can be explained by the increased turbulence in the bulk of the flow. The increase in turbulence intensity in the flow caused by both static mixers can be seen in the next figure.

Benefits of CFD
The level of confidence in the system performance and the detailed quantification of localised issues is one of the most advantageous features of computational analysis of this kind. The beneficial effect on the speed and effectiveness of design iterations will directly impact project costs and delivery as well as the quality of engineering.
Please see other related articles and case studies available at the PRE Technologies website. We are constantly updating our website and aim to have a wider range of case studies in the future, so do keep in touch.
Keep your curiosity in good shape.
For more information on this or any other technical white paper, please contact us.


