CFD based evaluation of Chlorination Contact Tanks (CCT)
Background
Chlorination is the most common disinfection method for public and private drinking water systems. This process is necessary to kill disease-causing bacteria in the water. Disinfection of water using chlorine requires accurate residence times, during which the water/chlorine mixture passes through a Chlorine Contact Tank (CCT) and a significant quantity of chlorine is consumed. Therefore, information regarding the residual chlorine in water supply systems is of great value in managing disinfectant concentrations.
PRE Technologies have developed a set of computational tools to optimise the chemical dosing and contact tank design. By means of numerical modelling techniques, significant additive and infrastructure savings can be achieved.
In this example, the flow hydrodynamics and solute transport are modelled with the aid of Computational Fluid Dynamics (CFD). This CFD model is then coupled with an appropriate kinetic mechanism to predict the chlorine decay.
The benefits of CFD analysis are outlined in terms of evaluation of design, efficiency of the CCTs and as a tool for tank optimization.
Methodology
The CFD model consists of the steady state simulation of an incompressible single phase flow, with water as the working fluid. Turbulence was modelled with typical numerical solver options for the conservation of mass, momentum and species. A constant and uniform velocity boundary condition was imposed at the inlet. The outlet was set as an opening on the top of the end wall to represent a weir. The water surface in the whole tank was modelled as a fixed interface which is free from shear.
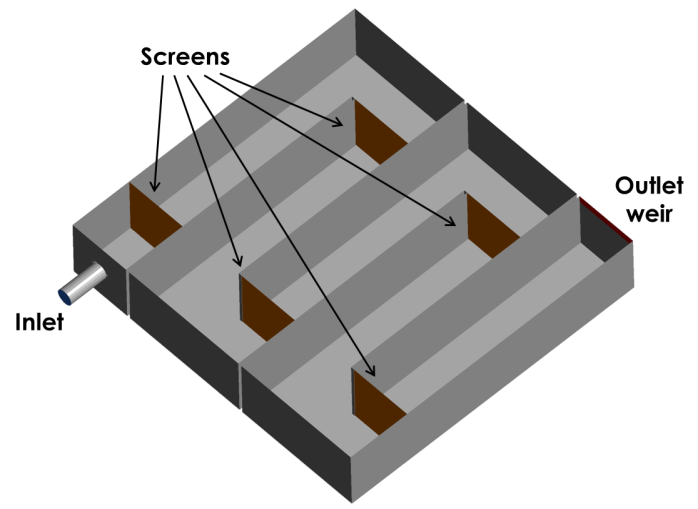
The following two pictures present the two geometries that were studied in this paper.

A transient simulation of the transport of a tracer species was used to characterize the performance of the CCT. A chemical species was introduced within the non-reacting flow at the inlet of the tank and the concentration of the tracer was monitored, as a function of time, at the outlet.
From the simulation it was possible to obtain the residence time distribution (RTD) curve to characterize the mixing and flow within the tank and to compare the behaviour of real tanks to their ideal behaviour. This is useful, not only for troubleshooting existing tanks, but in estimating the yield of a given reaction and designing future tanks. The RTD curve is the probability distribution function that describes the amount of time a fluid element could spend inside the reactor.
The ideal residence time distribution for a serpentine CCT is that of a quasi-ideal plug flow, i.e. a very narrow bell shape around the ideal residence time in the tank. In non-ideal flows, some degree of dispersion and mixing will be present, normally due to recirculation areas, which create an elongated tail in the RTD. At the same time, recirculation regions create adjacent flow paths which are faster in nature (short-circuiting flow), thus reducing the tank efficiency.
From the RTD it is possible to obtain performance indicators that are directly used to assess the hydraulic efficiency of the tank: the dead volume fraction, the efficiency of the tank and the dispersion index.
All the performance indicators can be used effectively when it is required to benchmark the tank performance. The performance of the CCT was benchmarked according to the following four-tier hydraulic performance, presented in the next table [C. Gualtieri, G.P. Doria, Residence time distribution and dispersion in a contact tank, 2007].

The distribution of fluid age was also assessed following the method described by Liu and Tilton (2010). The mean age method is an efficient tool to study mixing in steady continuous flow systems providing information of position of dead zones and short circuiting paths inside a vessel. Chlorine decay throughout the tank was also assessed knowing the age of the fluid elements inside the CCT and approximating them to perfectly stirred reactors. A first order decay kinetics was used to describe chlorine consumption in the contact tank. A standard average value for the chlorine decay constant was used as reported by Brown et al. (2011) [D. Brown, J. Bridgeman, J. West, Predicting chlorine decay and THM formation in water supply systems (2011)].
Example
The CCT geometry for modelling consists of a serpentine contact tank with 5 channels and a rectangular cross-section. Serpentine contact tank units are commonly used in the water and wastewater industry. The water stream is fed to the tank through an inlet pipe and the fluid is discharged from the CCT through an outlet weir (see figures above). In order to address the recirculation problems typically exhibited, the original geometry was modified, as shown above, by placing five porous screens along the CCT flow path. The first screen was placed in front of the inlet with the aim of dissipating the jet’s energy and allowing a better velocity distribution in the first channel. The remaining four screens were mounted at the beginning of each channel to improve the conditions of the turning flows between channels.
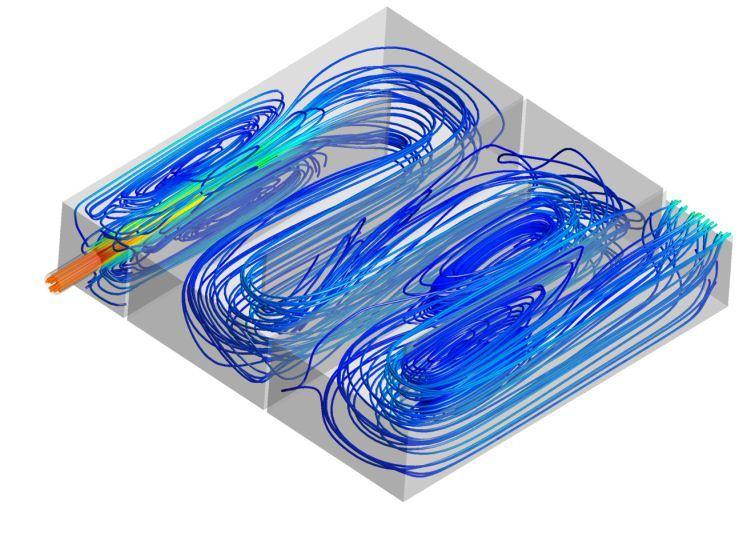
The next pictures show the flow pathlines obtained from the CFD model for both geometries (original on the left, optimised on the right hand side). Flow detachment and the consequent flow recirculation patterns can be observed for the original geometry. This behaviour is particularly evident at the inlet of the tank and is created by the inlet jet. Recirculation zones are also evident in the vicinity of the walls after the fluid bends, at the beginning of each channel.
Figure on the right shows the straightening of the flow in the channels in the optimised geometry. No flow detachment is observed, contrary to the original design.

The next set of figures show the tracer concentration contours at different moments after tracer injection in the system for the original geometry. It is possible to observe that the tracer is not transported evenly throughout the channels. There are preferential paths where the tracer is transported faster and zones where the tracer is retained for a longer time.

The concentration information at the outlet of the tank was gathered, resulting in the RTD (Residence Time Distribution) shown in the next figures (left), and its cumulative form (right). Results for the original geometry show a relatively wide-spread bell shaped RTD with an elongated tail which results from the recirculation patterns observed (black lines on the charts). On the other hand, for the optimised geometry, the majority of the flow is kept parallel to the side walls of the channel. This translates in the narrowing of the residence time distribution curve around the passage time through the CCT (light grey lines).


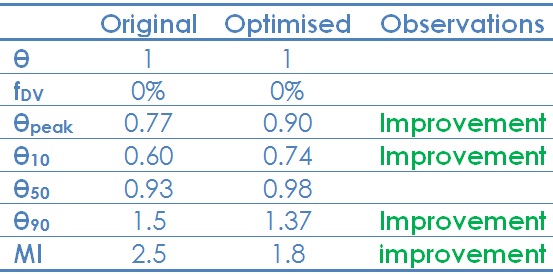
Based in the four-tier hydraulic performance presented above, results show that this CCT exhibits an acceptable behaviour with the original configuration and no stagnant zones are detected. However, a notable improvement has been obtained with the inclusion of baffles on the optimised geometry. Due to the straightening of the flow in the optimised configuration, the large recirculation zone in the first channel was reduced resulting in a smaller tail in the RTD, with a reduction in both θ90 and MI. Moreover, the degree of short-circuiting was also improved and higher tank efficiency is observed. The summary of the CCT performance with its two configurations is included in the next table.
The results of mean age distribution are presented next (original left, and optimised right). These figures show the location of the zones where the fluid is retained longer in the tank. These zones coincide with the zones where flow detachment occurs and flow recirculation is observed. The overall improvement in the performance of the optimised configuration is fairly obvious. The reduction in the flow recirculation zones inside the tank had a direct impact on the age of the fluid inside the tank, with the decrease of the maximum fluid age.


Simulation of the chlorine decay in the tank shows that the concentration of chlorine in the tank drops to around 68% of the original content injected for the original design. Moreover, regions where the normalised concentration of chlorine falls below the minimum recommended value of 60% are predicted where the fluid is retained for a longer time, as shown in the next figure (left hand side). For the optimised design. results show an increase in the minimum relative concentration of chlorine in the basin, in comparison with the original geometry, as a consequence of the reduction in the fluid age (right hand side figure).


Benefits of using CFD
Computational modelling of the fluid flow in CCTs was shown to be a valuable tool in the evaluation of the performance of these disinfection systems. It was also shown to be of great use in the optimisation of existing structures, through the selection of more precise and localised internal modifications that can lead to an improvement in the performance of the tank.
Please see other related articles and case studies available at the PRE Technologies website. We are constantly updating our website and aim to have a wider range of case studies in the future, so do keep in touch.
Keep your curiosity in good shape.
For more information on this or any other technical white paper, please contact us.


