CFD techniques determine gas-lift valve behavior
Wednesday, March 5, 2014
A novel approach using computational fluid dynamics techniques provides a way for determining the characteristics of gas passing through a gas-lift valve

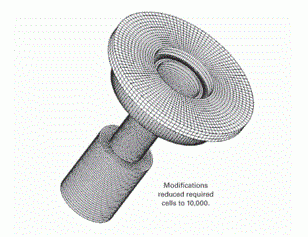
In the method, CFD calculations numerically solve the governing equations for a flowing fluid. To facilitate the simultaneous solution of the governing equations, the procedure involves dividing the flow space (the inside of the valve available for gas flow) into sufficiently small finite volumes or cells. The accuracy of flow modeling greatly depends on the proper setup of these cells. This article describes this spatial distribution.
After one properly sets up the cell structure in the gas-lift valve’s inside gas passage path, CFD calculations can determine the gas volumes passed by the valve under static conditions for different combinations of valve stem travel, injection, and production pressures.
In dynamic conditions, however, valve stem travel is a function of the net opening force on the valve stem tip. The authors developed an iterative procedure to describe this valve behavior that finds this force by integrating the pressure distribution on the valve stem tip.
The result of the proposed model is the dynamic performance curve of the gas-lift valve from which one can obtain the injected gas rate vs. injection, production, and dome charge pressures.
The procedure developed results in gas injection rates close to those determined from the API RP11V2 model.
Characterizing valves
Although gas passage characteristics of gas-lift valves are important, the industry did not investigate the problem in depth for many years. In the past, the static force balance equations and the assumption that valves while open behave as square-edged orifices described the performance of gas-lift valves.
This characterization assumed that the valve quickly and fully opened as soon as the injection and production pressures satisfied the opening conditions.
When the valve was fully open, the basis of the gas flow rate calculations was the valve’s port size and the equation originally proposed by the Thornhill-Craver Co., which is valid for flow of ideal gases through fixed orifices.
Gas-lift valves, however, do not provide a constant flow area because the valve stem rarely lifts completely off the seat. The position of the stem, in relation to the valve seat is a function of the pressure conditions; therefore, the valve acts as a variable orifice.
Gas passage through gas-lift valves can occur under two different flow patterns: orifice and throttling flow. Orifice flow is similar to gas flow through a fixed choke, whereas throttling flow resembles flow through a variable-area Venturi device.
The orifice flow model occurs with the valve stem at its maximum travel when the valve port behaves as a fixed orifice. For a constant injection pressure, decreasing production pressures entail an increase in the gas rate until reaching critical conditions. Upon further decrease in production pressure, the injection rate remains at its critical value.
In throttling flow if production pressure decreases below the injection pressure, the gas rate increases due to the increasing pressure differential across the valve seat. After reaching a maximum value, injection rate linearly decreases with production pressure until gas flow ceases at the closing production pressure.
Numerical solution
Because an analytical solution of the basic flow equations is possible only for very simple cases, complex cases usually require numerical solutions, so-called finite element models.
The computational fluid dynamics program package used in this article performs a numerical solution of the governing equations using finite volumes. The program constructs these by dividing the flow space into a finite number of cells with finite volumes connected to each other.
It makes calculations at the geometrical centers of the cells (the node points) and first calculates the fluid and flow parameters. Then it solves the algebraic equations resulting from the integration of the basic differential equations at cell boundaries to obtain the five unknowns at the node points.
Simulation results
Simulations of gas-lift valve behavior consisted of the following main tasks:
- First, the simulation assumed a valve stem’s travel measured from the valve’s closed position.
- It then constructed the flow space using carefully measured dimensions of the disassembled valve.
- Next, the simulation assumed values for the prevailing bellows charge, injection, and production pressures.
- The CFD program solved the governing equations and calculated the spatial distributions of pressure, velocity, and temperature.
CFD calculation results determined the following two important operational parameters of the gas-lift valve under the assumed conditions:
- The net vertical force acting on the valve stem.
- The gas flow rate across the gas-lift valve.
 |
Valve performance curves
The valve performance curve describes the dynamic performance of the gas-lift valve and presents the valve’s gas throughput capacity for different injection and production pressures at a given bellows charge pressure.
As previously mentioned, gas-lift valves can have two main kinds of behavior: orifice flow or throttling flow. Orifice flow occurs when valve stem travel is at its maximum and the valve behaves like a simple orifice. Throttling flow, on the other hand, occurs at smaller stem travels when the valve behaves as a variable-orifice Venturi device with a restricted gas-injection capacity.
It follows from the nature of the two possible flow conditions that CFD calculations easily simulate orifice flow. This is due to the fact that the valve stem is always at its maximum upward position so that the simulation run easily finds the gas rates. One simulation, therefore, can provide the valve performance curve for orifice flow.
Throttling flow, however, is more complicated to describe because the valve stem assumes its equilibrium position as the result of the different forces acting on the stem. These forces come from the dome charge and the injection pressures acting on their respective surfaces in addition to the net force acting on the valve stem’s tip.
Because CFD calculations require the knowledge of the actual valve stem travel to calculate the pressure distribution and consequently the net force arising on the stem’s tip, deriving the valve’s performance curve requires an iterative procedure.
The analysis bases the iterative solution on the fact that at equilibrium conditions the sum of the forces acting on the valve stem is zero. The four forces involved are:
- Dome charge pressure acting on the full bellows area.
- Spring force arising in the metal bellows.
- Net force acting on the valve stem’s tip.
- Injection pressure acting on the difference of the bellows and port areas.
The sum of the two first forces, as calculated in Equation 6, tries to close the valve. The equation properly considers both the increase in dome charge pressure due to compression of the bellows and the increase of spring force due to the increase of valve travel.
The two latter forces try to open the valve. CFD calculations using the injection pressure easily determine these forces. By setting the opening and closing forces equal, the calculation finds the valve’s actual stem travel. This is the principle of the iterative procedure.


